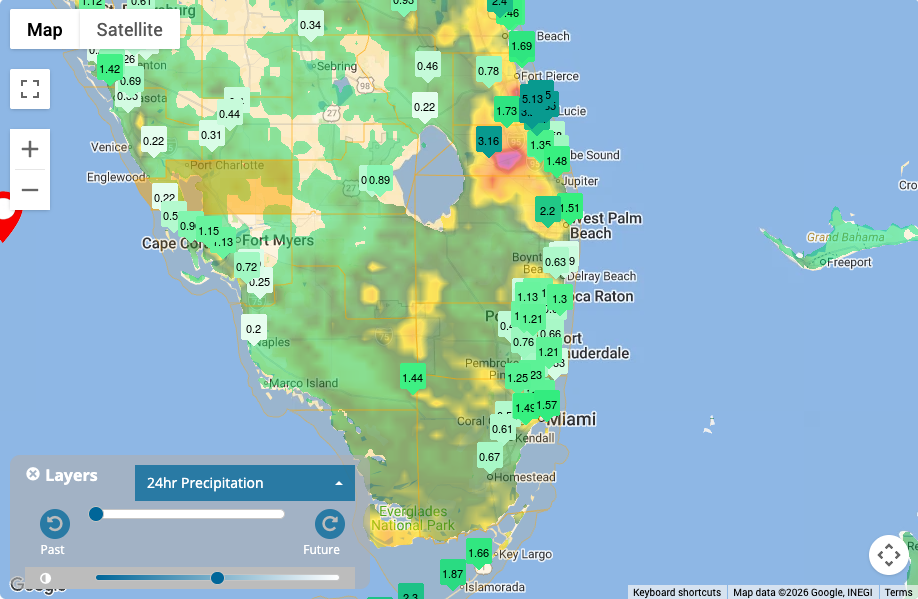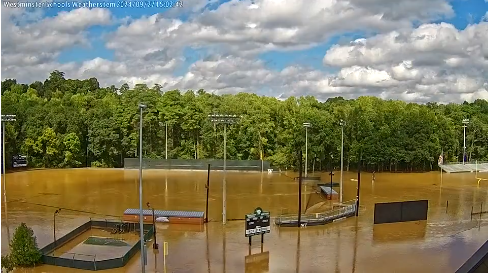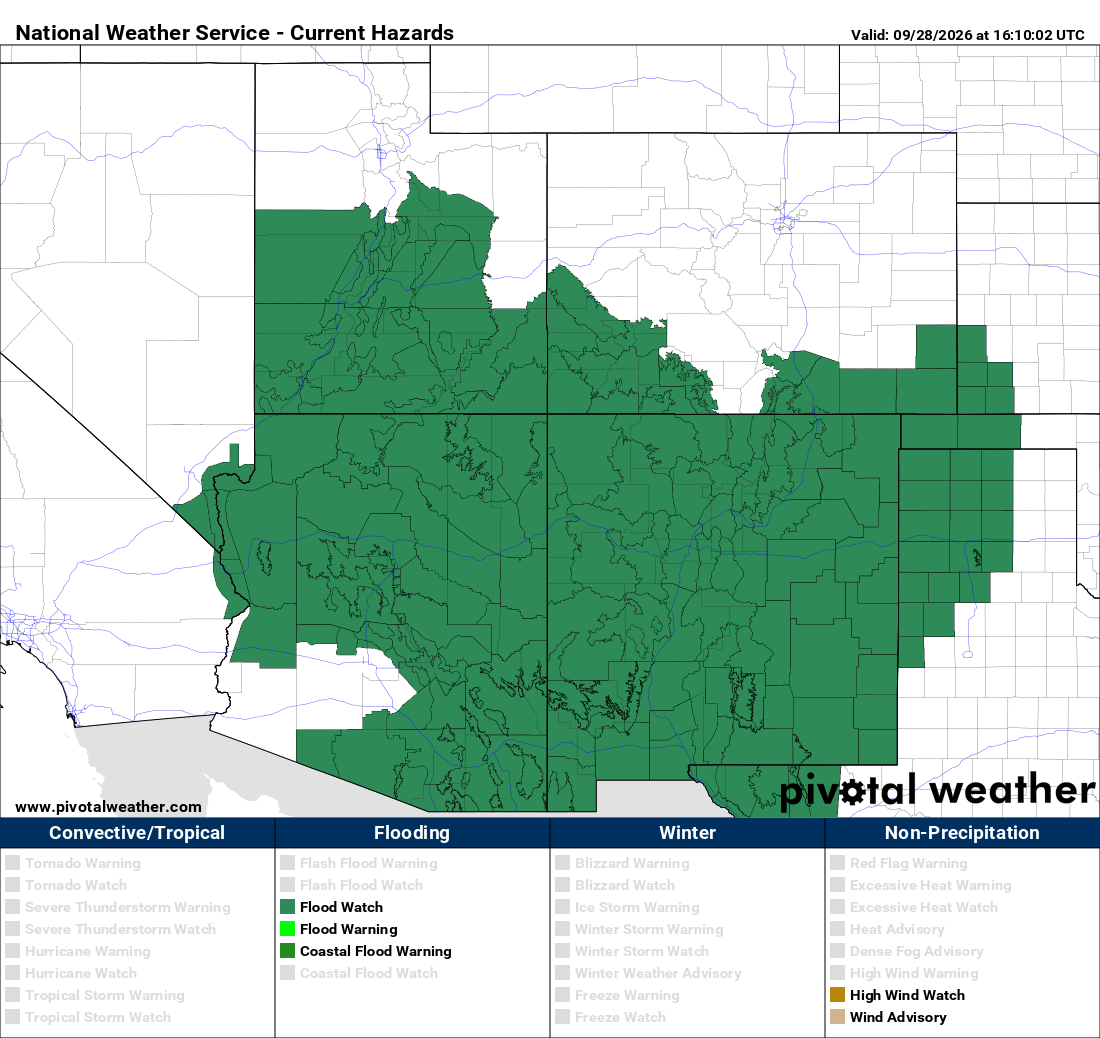
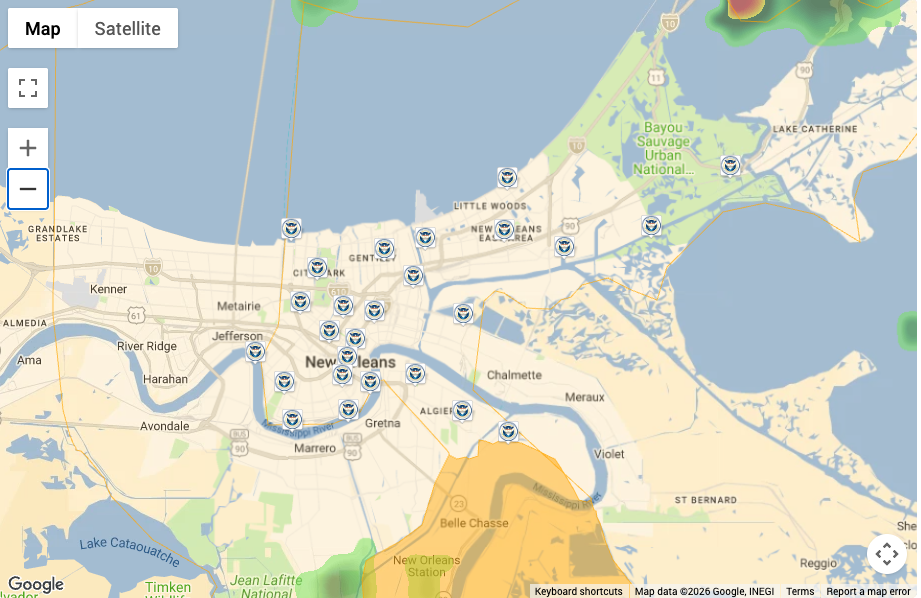
Urban flash flooding is not simply a matter of how much rain falls across an entire city. In developed areas, relatively small differences in rainfall can produce very different conditions from one neighborhood to the next. That's because flooding in a city depends on many local factors:
- Impervious surfaces such as pavement and rooftops
- Stormwater drainage capacity
- Terrain and elevation
- Underpasses and low-lying roads
- Creeks and drainage channels
- Development patterns
- Soil and vegetation
- Existing water levels in streams and ponds
- Previous rainfall
A regional forecast can tell an emergency manager that heavy rain is possible. Local weather observations can show how much rain is actually falling at specific locations across the community.
That local data complements, rather than replaces, National Weather Service (NWS) forecasts, radar, watches, and warnings. Official products define the broader threat. Local observations help emergency managers see how that threat is playing out across their jurisdiction.
Why Does Urban Development Increase Flash Flood Risk?
Cities don't always flood more than rural areas, but urban development creates specific pathways and vulnerabilities that change how rainfall turns into flooding. Understanding those pathways helps explain why localized rainfall is so important to monitor in developed areas.
- Impervious surfaces prevent water from soaking in. Pavement, rooftops, parking lots, and sidewalks shed rain rather than absorbing it, so a larger share of each storm becomes runoff.
- Runoff reaches drainage systems quickly. Water that would take time to move through soil and vegetation instead flows almost immediately into gutters, inlets, and pipes.
- Stormwater infrastructure has finite capacity. Drainage systems are designed to handle a certain amount of flow. When rainfall and runoff exceed that capacity, water can back up into streets and other low-lying areas.
- Infrastructure can concentrate or redirect water. Roads act as channels, underpasses collect runoff, and embankments can hold water in places it wouldn't naturally pool.
- Development alters natural drainage patterns. Filled wetlands, piped streams, and graded land can change where water goes during a heavy storm.
The result is that two neighborhoods can experience very different flooding from the same storm. One may drain efficiently while another, with older infrastructure, lower elevation, or more pavement, sees water accumulate quickly.
Why Can Rainfall Vary So Much Across an Urban Area?
It's easy to think of a storm as delivering the same amount of rain to an entire city. In reality, thunderstorms usually produce highly variable rainfall, even across relatively short distances.
- One part of a city can receive substantially more rain than another. An intense storm cell may be only a few miles wide, leaving one neighborhood drenched while another a short drive away stays relatively dry.
- Slow-moving or training thunderstorms can produce concentrated rainfall. When storms stall or repeatedly follow the same path, rainfall totals can climb quickly in one narrow area.
- Storm cells can repeatedly affect one neighborhood while another receives much less. Over the course of an evening, the rainfall difference between two parts of the same city can become substantial.
- Radar estimates can differ from what reaches the ground. Radar provides valuable regional coverage, but it estimates rainfall from the air above. Those estimates can differ from the amount actually measured at ground level at a particular location.
- A single citywide rainfall number can hide important local differences. An official observation at an airport, for example, may not reflect what fell over a flood-prone neighborhood across town.
This variability is why hyperlocal rainfall observations matter. Measurements taken at multiple points across a community show how rainfall is actually distributed, filling in the details that a single regional view can't capture.
How Does Local Rainfall Data Help Emergency Managers Monitor Urban Flood Risk?
Strategically placed weather stations make that variability visible to emergency managers. With local rainfall data, they can monitor:
- Current rainfall rates, showing where rain is falling hardest right now
- Short-term rainfall accumulation, such as the past 15 minutes or hour, which reflects the intense bursts that overwhelm urban drainage
- 24-hour and longer-term accumulation, showing how saturated an area may already be
- Differences between locations, revealing which parts of the community are getting the most rain
- Rapidly increasing rainfall totals, which can signal a storm intensifying or stalling
- Repeated rainfall over the same area, a sign that training storms may be targeting one neighborhood
Local rainfall data does not determine whether flooding will occur. It provides another observation that helps emergency managers understand how the rainfall event is unfolding, and where to focus their attention.
For a closer look at how these observations fit into flash flood response, from the watch period through an active warning, see How Emergency Managers Use Real-Time Rainfall Data During Flash Floods.
Where Should Weather Monitoring Stations Be Located in an Urban Area?
The value of local rainfall data depends heavily on where it's collected. A common approach is to place a single station at a central location, such as city hall or an operations center, and assume it represents the whole jurisdiction. Given how much rainfall can vary across a city, that single observation may miss what's happening where flooding is most likely.
A more useful approach is to place stations based on the community's geography and operational concerns. Locations worth considering include:
- Flood-prone roads that regularly require closures or barricades
- Low-water crossings, where rising water poses a direct risk to drivers
- Underpasses, which collect runoff quickly during intense rain
- Areas with recurring drainage problems, identified from past events and public works records
- Emergency operations centers, where real-time conditions support decision-making
- Public works facilities that dispatch crews during storms
- Hospitals, where access must be maintained during an event
- Schools, where weather conditions can affect closures, transportation, and other emergency management considerations
- Other critical facilities such as utilities, shelters, and fire stations
- Different elevations and geographic areas to capture variation across the jurisdiction, including upstream areas that feed local creeks
Station placement should reflect how water moves through the community and where decisions get made. That's also why a network of stations is often more useful than a single observation point: no one location can represent conditions across an entire urban area.
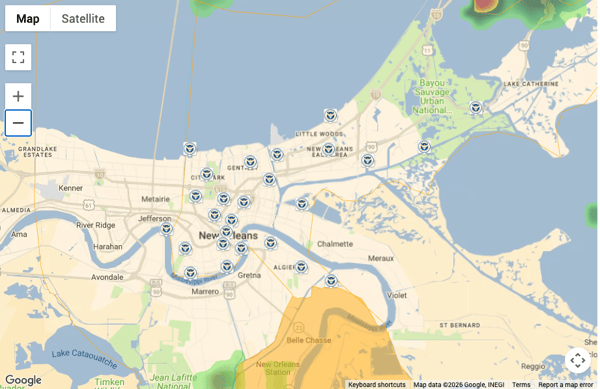
How Can Multiple Weather Stations Improve Urban Flood Monitoring?
A distributed network of weather stations gives emergency managers something a single station can't: the ability to compare conditions across the community in real time. With a network, they can compare:
- Rainfall rates from different neighborhoods, to see where the most intense rain is falling
- Accumulation across the city, to identify areas taking on the most water over the course of an event
- Upstream and downstream locations, since heavy rain upstream can drive rising water downstream even after local rain has eased
- Rainfall near critical infrastructure, such as hospitals, underpasses, and key roadways
- Areas experiencing repeated thunderstorms, where training storms may be building totals quickly
- Current rainfall against historical observations, to see how this event compares with past storms at the same sites
Consider a storm that produces intense rainfall on the west side of a city while the eastern side receives relatively little. A single station on the east side could make the rainfall appear relatively limited at that location. A distributed network shows the full picture: heavy, rapidly accumulating rain concentrated in one part of the jurisdiction, and a clear signal of where crews and attention may be needed.
This is where hardware and software work together. The stations collect observations where they matter most, and a centralized platform brings those observations together so emergency managers can see how rainfall is varying across their jurisdiction at a glance.
How Do Weather Cameras Add Context to Urban Flood Monitoring?
Rainfall measurements answer an important question: how much rain is falling? Weather cameras help answer a different one: what is happening at the location?
Paired with rainfall data, cameras can show:
- Water accumulating on a roadway as rain continues
- Conditions at an underpass that is prone to collecting runoff
- Visibility during heavy rain, which affects driving conditions and field operations
- Changing conditions around a monitored facility, such as a school, hospital, or public works yard
- Visual confirmation of conditions suggested by rainfall data, such as whether intense rainfall at a station coincides with visible ponding or other changing conditions at the monitored location.
Cameras have limits. They can't definitively determine flood depth, and they don't replace field reports from crews, first responders, or the public. What they do provide is visual context that helps emergency managers interpret the numbers and decide where a closer look may be needed.
How Do Weather Alerts Support Urban Flash Flood Monitoring?
A network of stations generates a steady stream of observations. Automated alerts help emergency managers focus on the ones that matter by flagging conditions as they cross levels that are meaningful for their community. Alerts can be built around:
- Rainfall-rate thresholds, such as a rate known to overwhelm drainage at a particular location
- Accumulation thresholds, such as a total over one, six, or 24 hours that has caused problems in past events
- Specific monitored locations, so an alert points directly to the underpass, crossing, or facility where conditions are changing
- Different thresholds for different locations, reflecting the fact that one neighborhood may flood at lower rainfall totals than another
Alerts bring attention to rapidly changing conditions and reduce the need to manually monitor every station continuously, which matters when staff are managing many responsibilities during a storm.
Automated alerts are a notification tool, not an automatic decision-making system. An alert is a prompt to look closer, check other information, and apply professional judgment. NWS Flood Watches and Flash Flood Warnings remain foundational sources of information during flood response. Local alerts help emergency managers see how conditions are developing within their jurisdiction while those official products are in effect.
How Weatherstem Supports Urban Flash Flood Monitoring
Weatherstem gives emergency managers localized observations from the places they are responsible for monitoring, providing another layer of information alongside forecasts, radar, watches, and warnings.
It does that by bringing the pieces described above into one system. On-site weather stations, placed at flood-prone roads, critical facilities, and other key locations, provide real-time rainfall measurements across multiple accumulation periods. Distributed station networks show how rainfall varies across a city or county, while weather cameras add visual context at monitored sites. Automated alerts flag conditions that cross the thresholds emergency managers define, and historical data supports comparison with past storms and review after an event. All of it comes together in a centralized software platform, so emergency managers can see conditions across their jurisdiction in one place.
Why is Urban Flash Flooding So Localized?
Within a relatively small geographic area, a city can have different rainfall totals, different drainage characteristics, different terrain, different infrastructure, and different flood-prone locations. That's what makes urban flash flooding so challenging to monitor, and why regional weather information benefits from being supplemented by localized observations from strategically monitored locations.
For emergency managers, the question isn't simply how much rain is falling across the region. It's where the rain is falling, how quickly it is accumulating, and what conditions are developing at the locations that matter most.
What causes urban flash flooding?
Urban flash flooding can result from intense rainfall combined with impervious surfaces, limited drainage capacity, terrain, development patterns, and other local factors that affect how quickly water accumulates.
Why can one part of a city flood while another does not?
Rainfall can vary significantly across an urban area, while drainage, terrain, infrastructure, and other conditions can also differ from one neighborhood to another. These differences can produce very different flooding conditions from the same storm.
How does local weather data help monitor urban flash flooding?
Local weather stations provide rainfall observations at specific locations, allowing emergency managers to compare rainfall rates and accumulation across a community. Weather cameras and automated alerts can add additional context to those observations.

Weatherstem
Real-time weather monitoring built for compliance and life-safety decisions.
Professional hardware, dual lightning detection, automated alerts, and permanent data logging — installed and managed for you. Used by emergency management agencies, athletic programs, and government operations nationwide.
Book a Free Demo